field chooser |Form 8949 Capital Gain & Wash Sales calculator software

Preset View


Section 1: Preset View
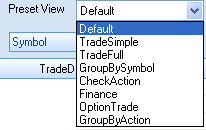
TradeMax provides the frequently-used view of the data grid. You can select one from the Preset View‘ dropdown list or skip it if you like.

Option
Description
Default Last selected Preset View
Tradesimple Display trade records with the frequently-used trade parameters
Tradefull Display trade records with the entire trade parameters
GroupbySymbol Provides you the data grid grouped by symbol
Checkaction Provides you a convenient way to check the Action and the ActionName by positioning together the two columns to the left of the data grid
Finance Display all cash flow trade records . Additionally, the data grid is grouped by Action.
Optiontrade Display all option related trade records
GroupByAction Provides you the data grid grouped by Action


Note:

  • The data grid is grouped by TradeDate by default.
  • If you customize the appearance of data grid manually and can’t find some column headers, you can get back your entire column header by selecting the option TradeFull in the Preset View or use Field Chooser function to drag column header back.



Custom Grid


Custom Grid

Part Two: Custom Grid

TradeMax provides you a simple and flexible way to group the data and customize the appearance of data grid: you just need to drag and drop the column header with your mouse.

Let’s take an example:

  1. Select the TradeSimple in the Preset View
  2. Press the Group By Box, Field Chooser button on the View group box in the Trade tab. (refer to its function in Group By Panel notes )
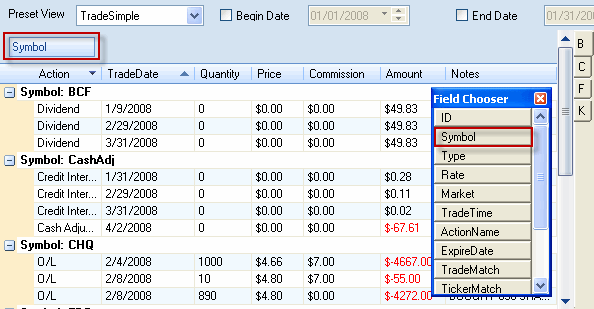
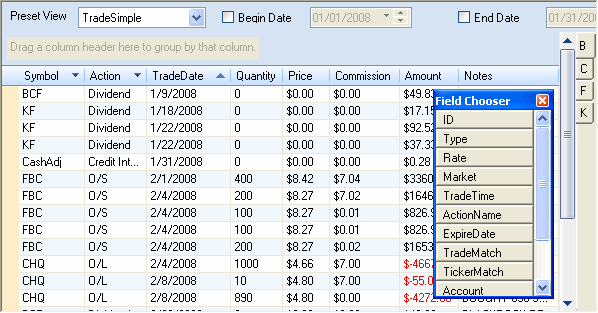
  3. Display the following grid:In this grid, you will see:
  4. The Group By panel displays on the top of the data grid

    The Field Chooser box is floating on the data grid. In addition, the Field Chooser is used to set the fields which are dragged out of the grid header.

  5. Group the data and customize the grid
    1. To group the data by single column header (Symbol), you can drag and drop the column header Symbol to the Group By panel.The following grid displays:

      The column header Symbol is out of the data grid header and appeared in the Field Chooser box.

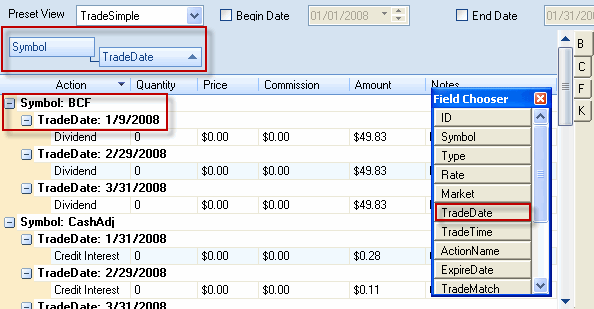
    2. To group the data by multiple columns (for example, group by Symbol first and then group by the TradeDate), following the first step, then you can drag the column header TradeDate to the Group By panel after the Symbol.The following grid displays:

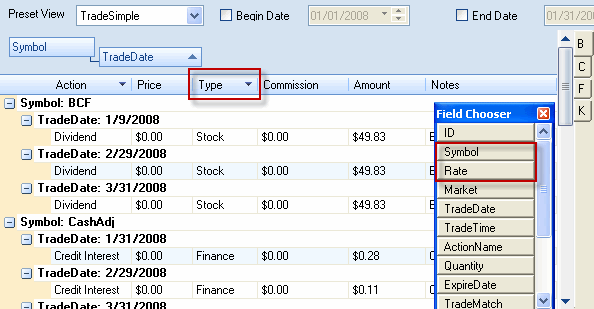
    3. If you think there are too much columns in the grid, you can hide any one of them by drag it to the Field Chooser box. Under this situation, the data will not be grouped by that column. (This is different from the above Group By panel function). You can drag and drop it like the following:And you will get your desired grid like this:
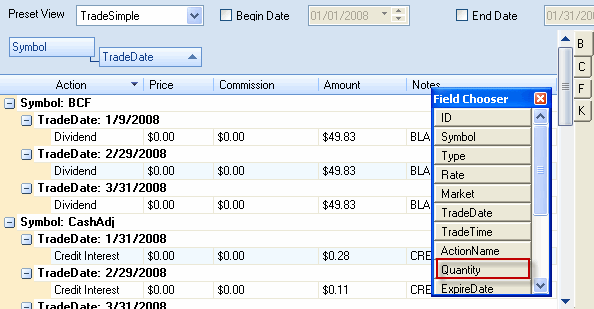
      The column header Action appears in the Field Chooser box.

    4. If you want to drag the column header Symbol back to the grid header, you can follow the instruction like this:Then the following grid appears:

      Now, the data in the grid is grouped by Symbol first and then the TradeDate.


Page 1 of 11

Copyright © 2008-2016 Neutral Trend Inc. All Rights Reserved.